


Miami-Dade County Commissioner District 7
For reasons that don’t have a clear explanation, it has taken me and my staff a total of five months to obtain the mean sea level figures shown below. Because sea level is determined not only by the classic factors (thermal expansion of water with temperature increase, movement of tectonic plates under the sea, and melting of ice caps), but also unique geographical phenomena that affect our region only, it is important to focus on recent data. This is made particularly imperative by projections that flow from the accelerated increase of the last five years.
And so we are pleased to be the first to print with a rather graphic comparison of the last three years as shown below:
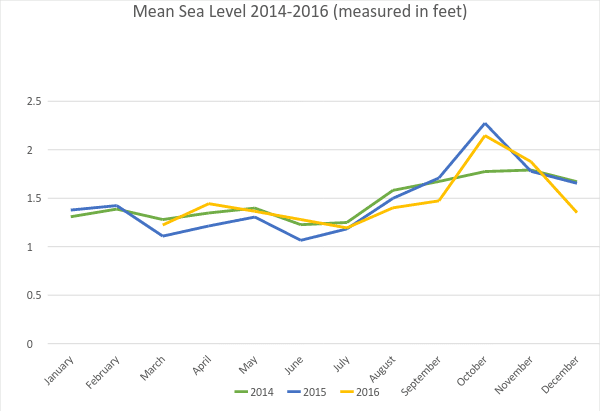
The graph above represents the mean sea level, measured in Virginia Key, from 2014-2016. It is evident that in 2015 and 2016, there is a peak sea level around October. Miami’s seasonal king tides occur around the month of October, with 2015 experiencing an even higher fluctuation due to the tides being powered by a rare supermoon. Although this graph shows the seasonal tidal fluctuations, it does not leave us with any conclusive answers.
As ‘ground zero’ for sea level rise, Miami-Dade County (“the County”) faces a plentitude of risks which negatively affect residents’ potable water, seacoast construction, transportation systems and wastewater plants. Millions of dollars of funding have been spent due to increased saltwater intrusion, severe urban flooding, drinking water pollution, and power plant substation flooding and subsequent power outages.
To provide a background, the National Oceanic and Atmospheric Administration (“NOAA”) and its predecessors have been collecting oceanographic and atmospheric information from all over the world since 1807. The NOAA has compiled a sequence of predictive scenarios that depict sea level rise projections based on varying degrees of risk. Unfortunately, these projections cannot adequately account for South Florida’s proximity to the Gulf Stream and the discrepancies in yearly flooding that occur due to seasonal changes. The proximity to the Gulf Stream alone creates uncertainties as to how to tackle the potential adverse risks that the County could incur.
The sea level rise projection curves vary based on the predictive scenario. By 2030, the IPCC (median scenario) predicts 6 inches of sea level rise; the US Army Corps of Engineers (USACE) (high scenario) predicts 10 inches; and the NOAA (high scenario) predicts 12 inches. There is a considerable difference between those three predictive scenarios. The planning associated with costal protection will vary significantly depending on which scenario is accurate; leaving a wide range of possibilities for the next few decades.
For instance, the NOAA predicts that under the highest flood risk scenario due to sea level rise, Miami Beach could experience severe daily flooding by 2045. Seeing as approximately one-fifth of the County’s urban areas are within one foot of sea level during high tide, there is a significant threat to infrastructure. Costs associated with infrastructure damage prevention for a mere one-foot increase in sea level rise could cost the County as much as $6.4 billion in taxable real estate.
The Intergovernmental Panel on Climate Change (“IPCC”) model predicts approximately 20-25% weakening of the Atlantic overturning circulation by 2100. There is a disproportionate relationship between the Florida Current and its effect on sea level rise, whereby a decrease in current transport results in an increase in sea level in Miami. The Florida Current transport has decreased approximately 9% since 2005. Sea level at Miami increases in proportion to the Florida Current decrease. For example, a 9% decrease in the Florida Current yields roughly 5 cm sea level rise at the coast.
We are geographically unique in relation to other coastal areas; the Atlantic overturning circulation and its effects on the Florida Current are only seen on our coast. Miami is at greater risk than anywhere else in the United States, and unless we choose a predictive scenario to follow, we will not have a system of measurement in place that will allow us to make the preventative decisions necessary to protect our beloved coastlines.
Currently, Miami Beach is working on a component of their anti-flooding project to raise roads, install pumps and water mains, and redo sewer connections during the next few years. This project alone is estimated to cost about $400-500 million. With the high costs associated with these preventative initiatives, we cannot help but wonder if we are acting too presumptuously, or not cautiously enough.
The graph below represents the mean sea level at Virginia Key (measured in feet) from 2000-2013. Even over a 13-year span, it is still quite difficult to analyze the trend in the data as showing any significant increase or decrease in sea level. The NOAA has collected data that shows a rise of six inches since 1992. However, data analysis over a shorter period of time leaves us with a whole lot of questions, and not too many quantifiable answers.
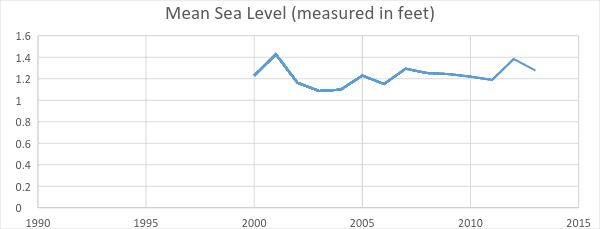
There have been some years where sea level has actually decreased since the previous year. This leaves many wondering if there is any validity in the idea behind climate change. If the three generic factors contributing to sea level rise, which are: thermal expansion, melting of ice caps, and tectonic plates affecting ocean depth, are truly having a significant effect on our seas, then why are we not experiencing a proportionate increase in sea level rise every year?
This poses a question to our beloved South Florida: Do we sink or swim?
Miami-Dade County Commissioner Xavier L. Suarez can be reached at 305-669-4003 or via email at district7@miamidade.gov.


Comments are closed.