
|
Getting your Trinity Audio player ready...
|
co-authored by Xavier Suarez and Yvonne Maffia, with special thanks to Brian McNoldy, senior research associate at University of Miami’s Rosentiel School.

Sea level rise trends have become substantial drivers for policy makers who are tasked with finding ways to protect the health and viability of coastal populations. There is an array of sea level rise projections from the National Oceanic and Atmospheric Association, NOAA (ranging in risk level) that are designed to steer governments and individuals in the right direction in terms of proper planning and execution of sea level rise prevention, mitigation, and adaptation strategies. Independent of the scenario we adapt as a guideline for policymaking, we cannot ignore the indubitable fact that sea level rise has been trending upwards long-term and unfortunately, is imminent. With that in mind, we should carefully choose how to not only analyze the data, but how to use both the short and long-term trends to our advantage, while taking into account all extraneous factors that affect these trends.
When analyzing sea level rise trends, making a comparison from one year to the next and extrapolating a data set in order to infer a correlation to a long-term trend is not a particularly sound method of analysis. Sea level rise, like most other natural phenomena, is ideally analyzed in a multi-year manner, as there are too many acute influences and variables that can mimic a positive or negative fluctuation and skew the data.
However, as a county that has one of the highest recorded sea level rise rates to date, short-term trends can be useful when monitoring resilience plans, urban planning and building, and emergency preparedness. They can serve as a nice check point to help keep us on track and stay proactive in our approach to natural events such as king tides, hurricanes, storm surge, and sunny day flooding.
Now, let’s take a look at the data and the factors that can influence the data:
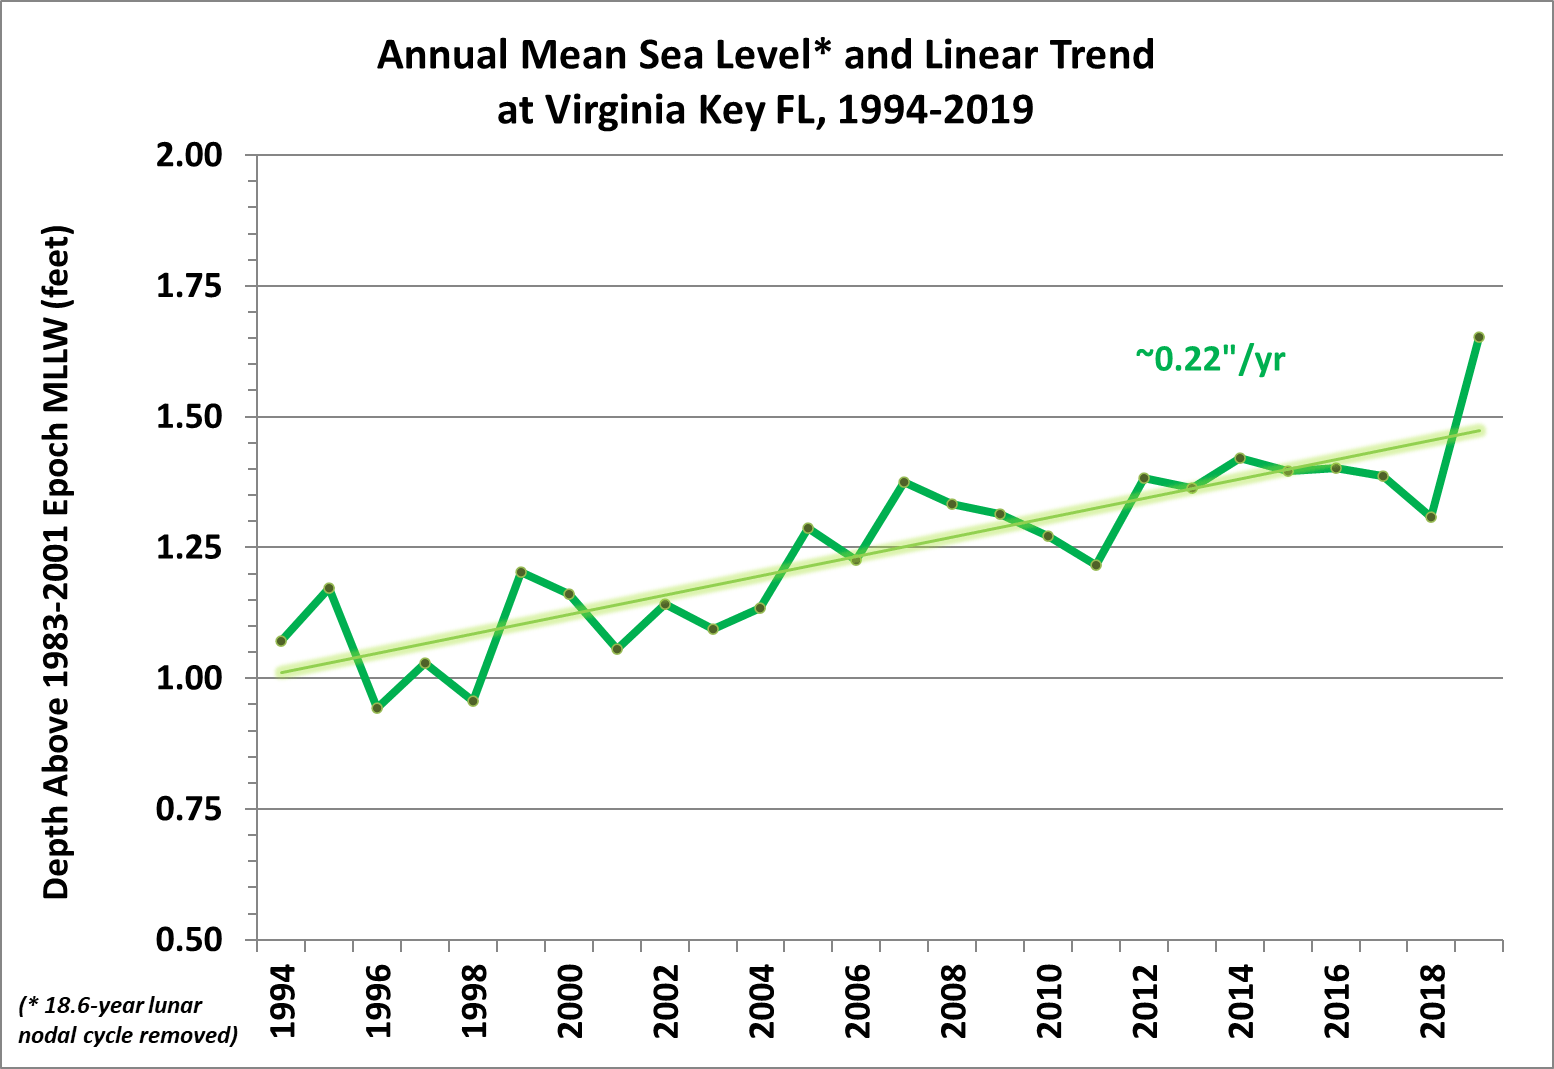
Locally, Miami-Dade County is experiencing a long-term trend of approximately .22 inches per year or 2.2 inches per decade. From an immediate perspective, what this means is that within the next five years, all other factors being equal, the mean sea level might be an inch or so higher than it is now. However, if we isolate the last five years and extrapolate the data, the trend works out to .28 inches per year. This may not seem like a significant difference, but could be crucial in terms of acute policy decisions, mitigation of natural weather events, and emergency preparedness.
The graph below (created by Brian McNoldy, Senior Research Associate at the University of Miami’s Rosentiel School) illustrates the long-term linear trend from 1994-2019: this shows us that over 25 years, we are looking at a trend of approximately .22 inches per year or a little less than two feet per century. The numbers trend slightly higher in the last quarter century, possibly due to the Gulf Stream.
King tides: South Florida tends to experience its highest seasonal tides or “king tides” between the months of August and November. There are additional influences, such as a storm’s approach to the coastline, that can contribute to an even higher tidal event.
This year, the second week of October has the highest predicted tide. It’s important to note that the highest predicted water level will always line up with the full moon or new moon from mid September to mid October.
Perigean new moon: the moon does not orbit the earth in a perfect circle. When it is closest to the earth, it is called perigee, and when it is furthest away from the earth, it is called apogee. Now, when the moon’s proximity varies ever so slightly the difference may not seem like much, but the slightest change can drastically influence the tides because of how close the moon is to the earth. This past year, the moon made its closest approach to earth in April, and a full moon happened on the same day. This resulted in a drastic high tide. Fortunately for us, the average tide levels in April are not that high, so even though there were a couple extraneous factors at play, the tide levels were still not nearly as close as what we typically see in the fall.
Lunar nodal cycle: The Lunar nodal cycle is an 18.6 year decadal-scale variation. We entered the “down phase,” which constitutes half of the cycle, in 2017. We will enter the “up phase” of the cycle in 2026. The lunar nodal cycle is important when analyzing data trends because it acts to enhance or suppress sea level rise and can contribute to falsely to the data trends if not accounted for correctly. In the next five years, we will see a continuation of the “suppression” of apparent sea level rise. This means that even if the rise keep increasing, it will be increasing at a much lower rate than what is apparent.
The Gulf Stream: The Gulf Stream is a strong current that carries warm water from the Gulf of Mexico into the North Atlantic. It is influenced by Atlantic winds and varies in strength due to the natural fluctuations in climate. Accumulated effects of climate change have potentially caused a decrease in the Gulf Stream’s strength, which means that it will flow more slowly, causing sea level rise to increase.
Policy solutions: If municipalities have the extra capital, it would be advisable to take extra precautions and plan for the worst-case scenario. However, having a plethora of non-allocated monies is a rarity for governments, and we should therefore opt to adhere to the most reasonable and data-driven scenario, which, according to the current trends, would be the 2017 NOAA intermediate-high risk scenario.
Reactionary policy that incorporates solutions such as pump stations or raising of the roads can present a false sense of security. There is an obvious need to address the imminent threat of issues such as drastic flooding, but often times these are merely attempts to fix the problem in the short-term. These solutions do work in that capacity and should not be completely disregarded; but they should not be seen as a permanent or long-term solution to sea level rise.
Storm surge can reach a devastating height of twenty-eight feet. Hurricane Andrew had a 17-foot peak storm surge and still managed to wreak havoc in Miami. As policy makers, we should encourage the use of natural barriers to surge such as dunes. The grassy dunes over on Collins Avenue in Miami Beach are an example of dunes that are successfully mitigating the effects of storm surge.
Miami-Dade County and other large Metropolitan areas often experience what is know as the “urban heat island effect.” This notion suggests that the urban area is significantly warmer than its surrounding rural areas because of human activity such as over-paving and bricking. We should be proactive and try to incorporate alternatives that include more tree canopy and green building whenever possible.
There has already been a westward shift in new development in Miami-Dade County, a trend that is known as “climate gentrification.” To quantify what this looks like in terms of elevation, seaside elevations generally sit at approximately three feet above sea level; whereas places like Little Haiti and Little Havana lie at around 7 to 10 feet above sea level. Future building codes should require an elevation standard that is consistent with our sea level rise trends and perhaps a stipulation requiring an area of unoccupied space at the bottom of each new structure.


I would urge the policy and decision makers who are responsible for the thinking and planning involved in finding solutions to sea-level rise to contact The Nature Conservancy of Florida. This organization has studied this issue and has, through science and demonstration, created a number of answers to this problem. These answers are nature based and proven, not only workable, but much less expensive than man-made solutions such as those being considered by the Army Corps of Engineers. The Army Corps of Engineers is proposing miles and miles of walls, some as high as 13 feet, along the Atlantic coastline, the neighborhoods of Edgewater and Little River and Miami River . The Corps has a very poor record of managing water in Florida; think of their work in the Everglades. Building walls will, by definition, be ugly and very expensive with no guarantee that the problem will be adequately fixed. Walls will diminish the natural beauty of Florida’s
coasts. Walls will negatively affect tourism and property values.
Again, the Nature Conservancy of Florida has solutions that will work and will enhance both the beauty and value of our coasts.